2022 Movie and Television Review
The best movies I watched this year
- The Batman
Although a little heavy on the emo, I really enjoyed watching a non-superheroey super hero movie. The villains are all too real: crime bosses and Q-Anon types. And Batman is convincing as the type of rich disturbed loner who would spend his nights slumming it in Gotham City, beating up criminals. The only major complaint I have is that it was a bit on the long side, but the way it looked in IMAX made me more forgiving.
- Shrek 2
What a great film. Funny for kids and adults, and twenty years later still looks fine. After re-watching it this year, I bumped it up to sixth on my all-time favourite animated movies (it was ninth). Finding Nemo had to take the fall.
- Coherence
Not a perfect film (not such a fan of people screaming at each other), but thought-provoking. The unconventional way they filmed it made the dialogue ring true. And the ending is shudder-inducing.
Honourable mentions:
Phantom Thread
Excuse My French
Rushmore
The Talented Mr. Ripley
Dishonourable mentions:
Chappie
Caddyshack
Happy Gilmore
The best shows I watched this year
- Don’t Hug Me I’m Scared
This was a television show that followed on from some internet shorts of the same name (which I adored). The show is even better though. More time to really delve into the themes in the uniquely dark but funny way they do. We get a satirical look at work, death, family life, friendship, the suburbs, and the meaning of existence. After we finished watching the season, we immediately watched it again; that’s how much we enjoyed it. Some really catchy songs too.
- Severance
One of those shows that make you constantly ponder what you would do if you were in the shoes of the protagonist. Incredibly well-made, even if I did think the pervasive foul language was a bit much. Could have easily been shown to a wider audience if they’d had more restraint. I understand the desire to capture true to life dialogue, but this is not The Wire or something; it’s essentially a science fiction show.
- Formula 1: Drive to Survive (Season 4)
Sign me up for as many seasons of this as they make. A more interesting story line than the other seasons as well since the competition had more parity. I’d like to see more sports film reality shows of their events. And this is one where the foul language is less noticeable and more excusable–we get to listen in on the actual dialogue of drivers racing eachother at incredibly high speeds; they’re going to let some curses fly.
Now let’s get to the stats!
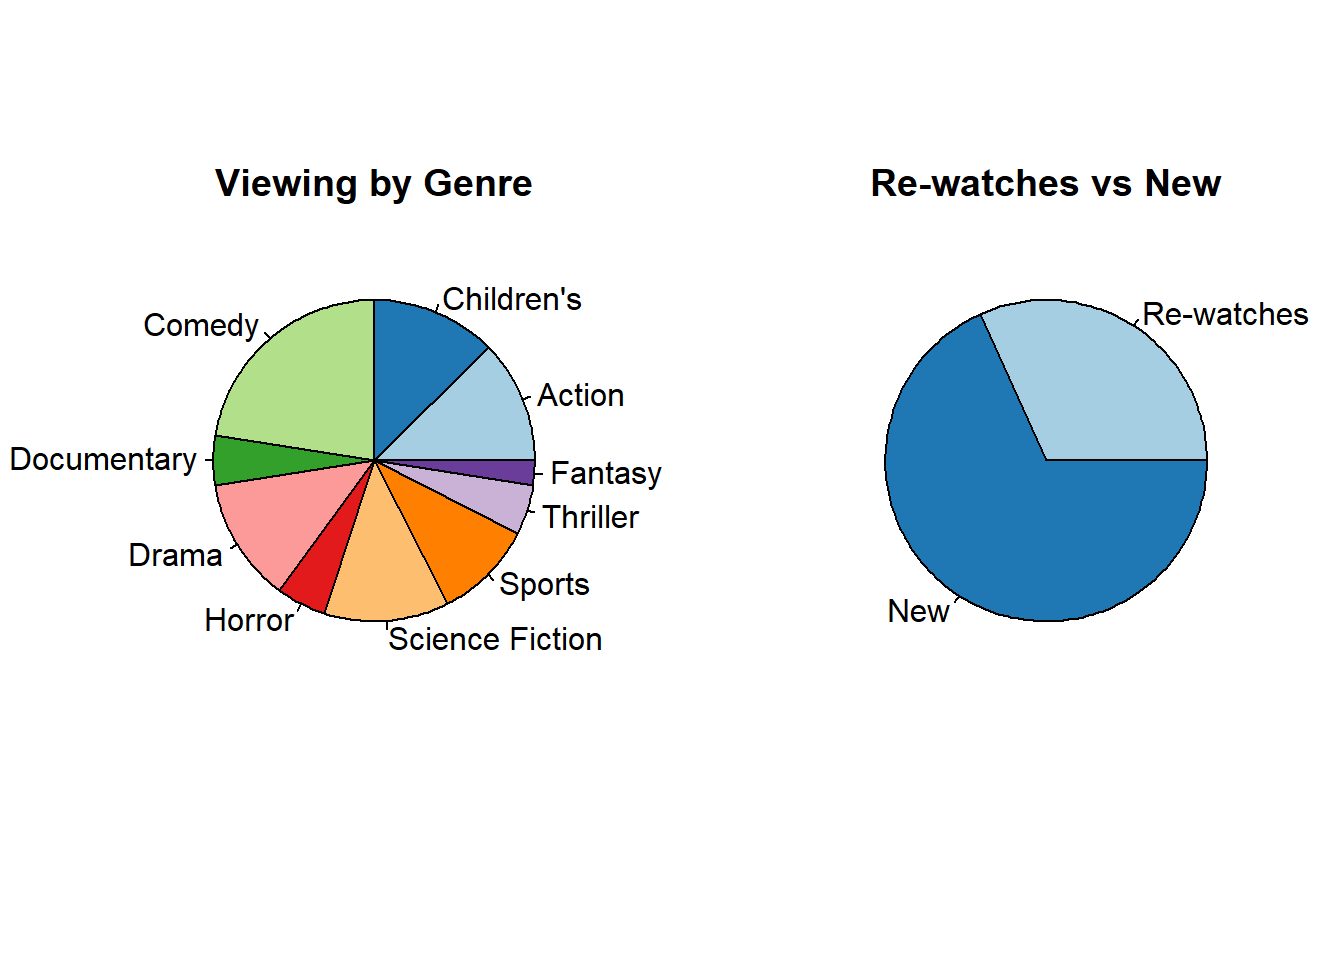 This year I also began keeping track of how much I enjoyed each movie and how good I thought each movie was. So I can see which type of movies I tend to enjoy.
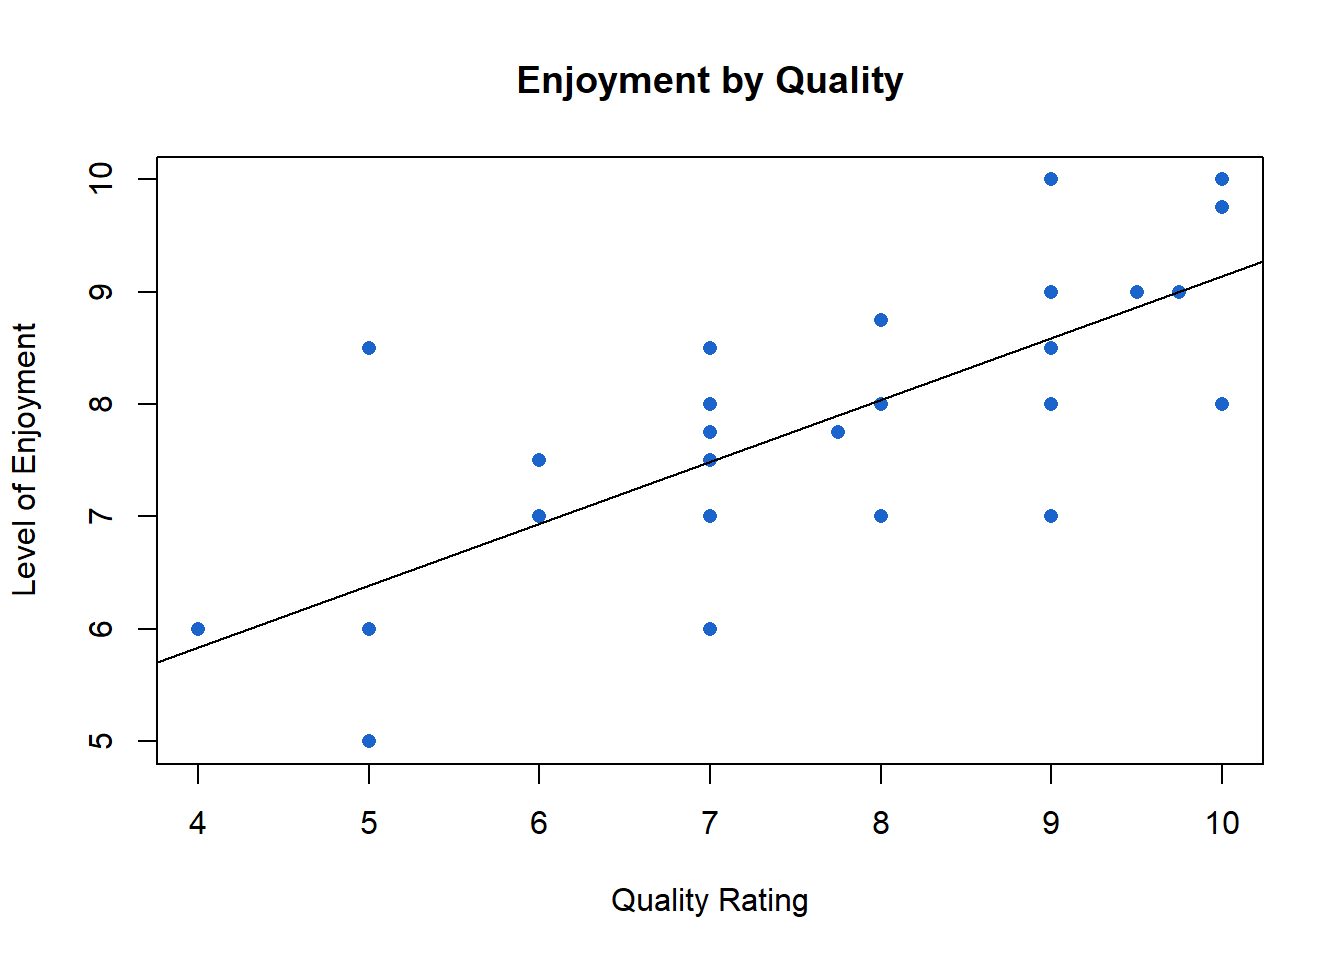
Well, it is clear I enjoy movies that I think are well-made. While that may seem obvious, I wasn’t sure if it would be the case given that I like plenty of dumb movies–movies I know are bad. But, as you can see in the scatteplot above, there is a clear relationship between my self-rated level of enjoyment and my assessment of film quality (Pearson’s R = 0.69).1 As the quality rating rises, so do the enjoyment scores. That’s what the regression line shows: a one unit increase in a film’s quality rating leads to a 0.55 increase in my enjoyment.2 To put it another way, the quality score I assign to a film explains nearly half of the variation in my enjoyment scores.
But what about other indicators of quality? I did also record the Metacritic and Rotten Tomato scores for each film or show I watched. I won’t display the plots, but it’s fair to say that I mostly agreed with the critics about whether a movie was good.3 Me bumping up a movie a point is about equivalent to me bumping a movie up half a point for either Metacritic or Rotten Tomatoes.
But were the critic scores correlated with my enjoyment of a movie?
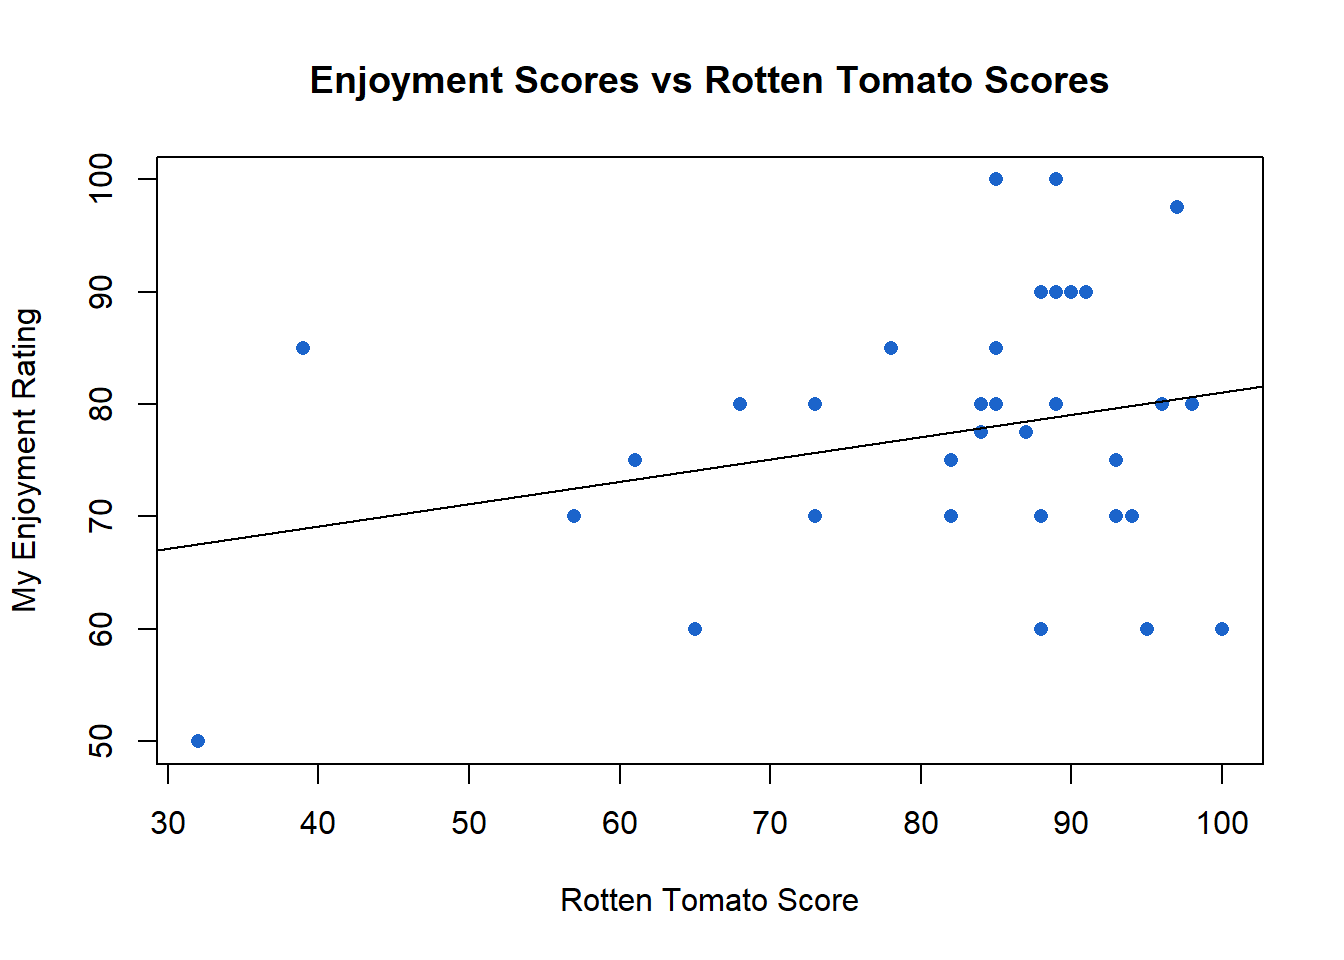
Not really.4 I only display the relationship between Rotten Tomatoes scores and my scores above (not Metacritic), but whether using Metacritic or Rotten Tomatoes, the results are similarly underwhelming. A one unit change in the Rotten Tomato score is associated with only a 0.2 change in my enjoyment score. Note that I’ve rescaled my enjoyment score to be out of 100 to put it on the same scale as the Rotten Tomato scores.5 To put that in perspective, imagine a movie that 20% of critics like on Rotten Tomatoes with a movie that gets a score of 80%. You’d imagine I’d like the 80% movie better, right? Well, this model predicts that I would only change my enjoyment score by 12 points, say from a 74 to an 86.
You can see evidence of this in the scatter plot–there are so many movies wildly deviating from the model’s prediction (i.e. falling far from the regression line). For example, you’ll notice there are several movies that got Rotten Tomato scores in the 90s that only get a 60 on my enjoyment meter. On the flip side, There are movies that I put in the 80s on my enjoyment scale, that score in the 40s and 60s on Rotten Tomatoes. To put it another way, both Metacritic and Rotten Tomatoes scores explain less than 7% of the variation in my enjoyment scores. In other words, the reason I like a movie appears to have almost nothing to do with the score critics give it.
Furthermore, the Rotten Tomatoes audience scores appear to matter even less (graph not included, I find too many graphs become wearisome). A one unit change in how much audiences like a movie is only associated with a 0.15 change in my scores. So a 20 point swing in the audience score is only equivalent to a 3 point swing in my scores. And it only explains about 3 percent of the variation in my scores.
The normal caveats about small samples apply here, of course. I’ll have to keep track another year or two before I have enough observations to be really comfortable abandoning Rotten Tomatoes, but the early signs are not encouraging.
Another category I tracked was the year of release for each movie. I wanted to see if I preferred newer to older movies. For reference, the average year of release for movies I watched this year was 2007.
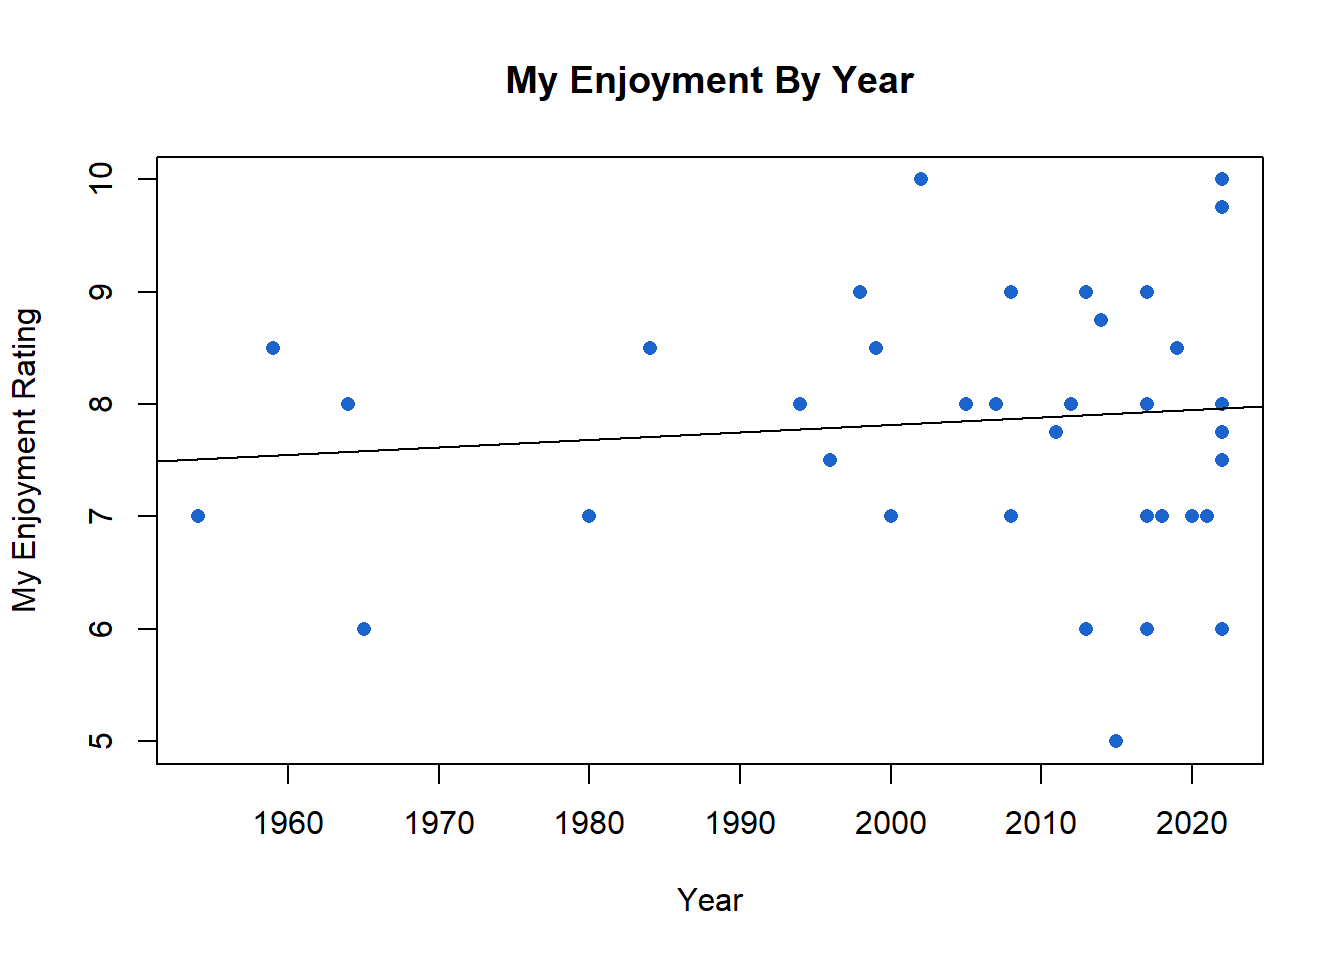
Again, basically no relationship.6 I enjoyed older movies as much as I did newer ones; of course, there were far fewer older movies in my watchlist. Three quarters of all the movies I watched were released in the past twenty years, with a quarter of those being released in 2020 or later.
For a quick explanation of Pearson’s R, also called the correlation coefficient, see: https://www.statisticshowto.com/probability-and-statistics/correlation-coefficient-formula/ ↩︎
By way of further explanation, the scatter plots I’m showing in this post all come with a regression line plotted using a basic bivariate ordinary least squares regression. That line is a line of best fit; it tries to predict the relationship between the two variables (shown on the Y and X axes). I’m not going to be tedious and present the regression tables (this is for fun!), but you can just eyeball the relationships or simply look at the regression line. A negative relationship will be shown as the line sloping down from left to right, and a positive relationship will slope up from left to right. The steeper the slope, the more correlated the variables. In the case of the scatter plot above, the steep slope indicates that the two variables are well-correlated. I’m also not going to bother reporting p-values. I don’t think they’re appropriate for several reasons. First, the observations are definitely not independent. For example, I watched two other Batman films because I had watched the newest Batman film in theaters. And secondly, the data generating process is not random at all. I deliberately chose which movies to watch and which movies to avoid based on some system, which may not even be entirely clear to me. Although in some cases it is–like I watched two horror movies in Halloween. But why did I watch Shrek when I did? Not sure. ↩︎
Mildly correlated scores (Pearson’s R = 0.46 & 0.4 for Metacritic and Rotten Tomatoes respectively. Both website scores only explain about a fifth of the variation in my quality scores though.↩︎
Pearson’s R = 0.16 and 0.26 for Metacritic and Rotten Tomatoes↩︎
Of course, my quality rating is a little different to a Rotten Tomato score in that I am assigning a movie a score, whereas Rotten Tomatoes is merely giving me the proportion of critics who positively rated a movie. The metacritic score is a little more analagous.↩︎
Pearson’s R=0.1, Regression coefficient = 0.006, R-squared - 0.01↩︎